Comments
You can use your Mastodon account to reply to this post.
In fact, CodeChecker is much more than just a front-end to Clang’s Static Analyzer (clangsa from
here on…) - but using it just to drive clangsa is already awesome enough that I think you should
use it to hunt for bugs in your C++ projects.
In this article, I’ll show how to set up and use CodeChecker for a quick one-off analysis of a CMake based C++ project, and outline how to use CodeChecker in a collaborative setting with the option of integrating it into a CI system. If you are not on C++, CodeChecker might still be for you, as it also supports multiple analyzers for e.g. Java, Python, Go, or JavaScript.
CodeChecker is a Python tool that drives static analysis tools (not just clangsa, though that is
what I’ll be focusing on in this article), and collects, visualizes and compares their results. If
you want to use it in a non-automated way, you use it by running a sequence commands in your
favorite shell.
This article is meant as a tutorial to get you to run your first analysis with CodeChecker. I’m making a few assumptions to keep this article from becoming too expansive: I’ll assume that you are working on Linux and that you have a recent-ish version Clang, Python 3 and the usual development tools installed. I’ll use a CMake based project as example, but it should be trivial to transfer this tutorial to most other build systems. CodeChecker has a lot of possibilities which I can not show in this article. If you want to get a fuller picture, please have a look at the CodeChecker documentation.
There are multiple ways of installing CodeChecker - again, please refer to the documentation for a
fuller overview. To use CodeChecker manually from the command line, I prefer the installation via pip:
1> pip install --user codechecker
On a default Python 3 setup on Linux, this should leave you with an executable file CodeChecker in
~/.local/bin.
CodeChecker relies on external tools (called analyzers in CodeChecker parlance) to actually
analyze your code. By default, three such analyzers are preconfigured: clangsa (which is basically
just Clang with a special command-line flag), clang-tidy and Cppcheck. However, CodeChecker might
not know where the respective executables are located on your system, or you might not have all
three installed. For example, I have various Clang versions installed (from LLVM’s APT repository),
so I would like CodeChecker to use /usr/bin/clang++-16 as clangsa.1
The only way to configure that right now is by editing the package_layout.json file bundled with
CodeChecker.2 If you installed via
pip as shown above, that file should be under
~/.local/share/codechecker/config/package_layout.json. This file should by default contain a
snippet like this:
1…
2  "runtime":
3    "analyzers": {
4      "clangsa": "clang",
5      "clang-tidy": "clang-tidy",
6      "cppcheck": "cppcheck"
7    },
8…
By editing these lines, you can tell CodeChecker where to find these tools on your system. I only
want to use clang++-16 as clangsa, and for the moment don’t care about clang-tidy and
Cppcheck, so I changed this to:
1…
2  "runtime":
3    "analyzers": {
4      "clangsa": "/usr/bin/clang++-16"
5    },
6…
Now that CodeChecker is ready to go, we need to get your project ready to be checked. As an example for this article, I will use Ygg, my intrusive tree library. This library was one of my first serious C++ projects (and I have not looked at it in a while…), so I fully expect it to contain some problematic code for Clang to find. Also it is really template-heavy, so it should present an interesting challenge for the analyzer.
Ygg uses CMake as its build system. It’s a header-only library, but it still contains a couple of targets to be built: Some tests, some benchmarks, and some hello-world-ish examples.
The first thing we have to do is to actually get the builds up and running. Note that while you can compile Ygg with a variety of compilers, it is highly recommended to use the same compiler to build as we will use later to analyze Ygg. Since we will later use Clang 16 as analyzer, we’ll force CMake to use Clang 16 for building, too:
 1~/src/> git clone https://github.com/tinloaf/ygg.git ./ygg
 2~/src/> cd ygg
 3~/src/ygg> git submodule update --init
 4[…]
 5~/src/ygg> mkdir build
 6~/src/ygg> cd build
 7~/src/ygg/build> export CXX=/usr/bin/clang++-16
 8~/src/ygg/build> cmake ..
 9[…]
10-- The CXX compiler identification is Clang 16.0.5
11[…]
12~/src/ygg/build> make -j
In theory, you don’t have to use Clang as a compiler in this step. The CodeChecker log command
that we run later also understands e.g. GCC invocations. However, some build systems (such as Ygg’s)
add special command-line flags depending on the compiler. Ygg adds the -fno-new-ttp-matching if it
detects GCC to work around a Boost bug (or is it a GCC bug?). These command-line flags will be
recorded in the compile_commands.json database and later passed on to clangsa, which does not
understand them.
Additionally, you should really also use the same Clang version for building as for analysis, especially if your project involves precompiled headers. Otherwise, the precompiled header will be built e.g. by Clang 15, and later Clang 16 will try to run an analysis with this PCH, which usually does not work.
So the recommendation is: Use the exact same Clang to build the project you want to analyze.
Now that we have a working build, we can tell CodeChecker about it. As many Clang tools do,
CodeChecker relies on a compilation database. We could (in a CMake-based project) just generate this
database by passing the -DCMAKE_EXPORT_COMPILE_COMMANDS=ON parameter to our cmake
invocation. However, CodeChecker provides a better way: CodeChecker log, which will be the first
actual CodeChecker command we run.
Let’s first create a working directory for all the files generated by CodeChecker:
1~/src/ygg> mkdir check
Now we use CodeChecker log to create a compilation database of all files built for a specific
target. To do that we just run CodeChecker log -b '<our build command>' -o path/to/compilation_database. So, in our case:
1~/src/ygg> cd build
2~/src/ygg/build> CodeChecker log -b 'make -j' -o ../check/compile_commands.json
3[…]
Let’s see:
1~/src/ygg/build> cd ../check/
2~/src/ygg/check> ls
3compile_commands.json
4~/src/ygg/check> cat compile_commands.json
5[
6]
7~/src/ygg/check>
Wait a second! If you followed the steps of the tutorial up to here, the compilation database will
be empty! Is CodeChecker log not very useful after all?
No, it’s actually doing exactly what it should: It records all files built. Since we already built
everything in the previous section, nothing was built now, and nothing is recorded. This is very
useful: If we are working on a project and we have already run CodeChecker previously, this allows
us to only re-run CodeChecker on those files (resp. translation units…) which we changed! You will
see that especially clangsa is not very fast, so this will come in very handy.
For now, we want a full compilation database, so let’s try this again, this time running make clean first:
1~/src/ygg> cd build
2~/src/ygg/build> make clean
3~/src/ygg/build> CodeChecker log -b 'make -j' -o ../check/compile_commands.json
4[…]
5~/src/ygg/build> wc -l ../check/compile_commands.json
6258 ../check/compile_commands.json
We have a compilation database and we are ready to run the first analysis!
The command to run an analysis is CodeChecker analyze. It accepts a couple of command-line
options, have a look at CodeChecker analyze --help for details. I will just be using two
arguments:
-o <report-dir> specifies the output directory for report data. This is the only required named argument.
–ctu enables Cross Translation Unit checks. A large part of the magic in clangsa happens by
reasoning about code paths that can and cannot be taken. Many of these code paths will cross the
boundaries of translation units, and are usually not visible to Clang tools, which work on one
translation unit at a time. With CTU, clangsa and CodeChecker do some magic to enable some
reasoning about code paths that cross TU boundaries. See the corresponding LLVM documentation for
details.
Aside from that required named option, CodeChecker expects the compilation database as positional
argument. So, let’s create a directory for the output, and let’s analyze:
 1~/src/ygg> cd check
 2~/src/ygg/check> mkdir report
 3~/src/ygg/check> CodeChecker analyze --ctu -o report compile_commands.json
 4[INFO 2023-06-05 21:50] - Enabled checkers:
 5clangsa: […]
 6[INFO 2023-06-05 21:50] - Pre-analysis started.
 7[INFO 2023-06-05 21:50] - Collecting data for ctu analysis.
 8[INFO 2023-06-05 21:50] - [1/19] example_rbtree.cpp
 9[…]
10[INFO 2023-06-05 21:52] - Pre-analysis finished.
11[INFO 2023-06-05 21:52] - Starting static analysis ...
12[INFO 2023-06-05 21:52] - [1/19] clangsa analyzed example_dump_to_dot.cpp successfully.
13[…]
14[INFO 2023-06-05 22:09] - ----==== Summary ====----
15[INFO 2023-06-05 22:09] - Successfully analyzed
16[INFO 2023-06-05 22:09] -   clangsa: 19
17[INFO 2023-06-05 22:09] - Total analyzed compilation commands: 19
18[INFO 2023-06-05 22:09] - ----=================----
19[…]
You see that it first lists all the enabled checkers, and then starts two passes over all translation units. In the first pass, it collect data for CTU, the second pass performs the actual analysis.3
Note that we did now run clangsa with the default list of checkers. A checker of an analyzer can
best be thought of as a certain type of bug that the analyzer can either search for or not. You can
list all available checkers (of all available analyzers) by running
 1~/src/ygg/check> CodeChecker checkers
 2[…]
 3optin.cplusplus.UninitializedObject
 4  Status: enabled
 5  Analyzer: clangsa
 6  Description: Reports uninitialized fields after object construction
 7  Labels:
 8    doc_url:https://clang.llvm.org/docs/analyzer/checkers.html#optin-cplusplus-uninitializedobject-c
 9    profile:default
10    profile:extreme
11    profile:sensitive
12    severity:MEDIUM
13[…]
Each checker has a name (optin.cplusplus.UninitializedObject in the example) and a set of
profile:<something> labels. Both names and labels can be used to enable or disable checkers. If
you want to enable a certain checker, you can pass -e <name or label> to CodeChecker analyze, if
you want to disable it, you can use -d <name or label>. So, as an example:
1~/src/ygg/check> CodeChecker analyze -e profile:sensitive -d optin.cplusplus.UninitializedObject …
This would run an analysis with all the profile:sensitive checkers enabled (additionally to the
default-enabled checkers), but optin.cplusplus.UninitializedObject being disabled.
Note that checkers starting with alpha. are considered under development and should probably not
be enabled, and checkers starting with core. should never be disabled, since other checkers depend
on them.
CodeChecker provides multiple ways of looking at the results. The first and quickest is by running
CodeChecker parse, which will print human-readable results to the console. I don’t think it’s very
useful when dealing with a project that yields many warnings, but it may be good if you fixed all
the warnings in your project and re-run CodeChecker after some changes, or to get a quick first
overview. For Ygg, it currently hits me with a wall of text:
1~/src/ygg/check> CodeChecker parse report | wc -l
21404
It spits out a lot of reports of this form:
1[LOW] ~/src/ygg/benchmark/bench_bst_delete.cpp:35:12: Value stored to '_' during its initialization is never read [deadcode.DeadStores]
2  for (auto _ : state) {
Just scrolling through these is not very useful. But at the very end it prints a nice statistic:
 1----==== Severity Statistics ====----
 2----------------------------
 3Severity | Number of reports
 4----------------------------
 5HIGH     |                 5
 6MEDIUM   |               227
 7LOW      |                90
 8----------------------------
 9----=================----
10
11----==== Checker Statistics ====----
12------------------------------------------------------------------
13Checker name                        | Severity | Number of reports
14------------------------------------------------------------------
15core.CallAndMessage                 | HIGH     |                 4
16cplusplus.NewDeleteLeaks            | HIGH     |                 1
17optin.cplusplus.UninitializedObject | MEDIUM   |               227
18deadcode.DeadStores                 | LOW      |                90
19------------------------------------------------------------------
20----=================----
21
22----==== File Statistics ====----
23--------------------------------------------
24File name                | Number of reports
25--------------------------------------------
26dynamic_segment_tree.cpp |                 2
27benchmark.h              |                 1
28[…]
29--------------------------------------------
30----=================----
31
32----======== Summary ========----
33-----------------------------------------------
34Number of processed analyzer result files | 19
35Number of analyzer reports                | 322
36-----------------------------------------------
37----=================----
This is of course not the best that CodeChecker can do. Let’s create a nice HTML output by passing
-e html (and -o <output_dir>) to CodeChecker parse:
1~/src/ygg/check> CodeChecker parse report -e html -o html_out
2[…]
3
4To view statistics in a browser run:
5> firefox /home/lukas/src/ygg/check/html_out/statistics.html
6
7To view the results in a browser run:
8> firefox /home/lukas/src/ygg/check/html_out/index.html
Let’s have a look at the main results view, which shows a nice table with each row representing one found (or rather: suspected) bug:
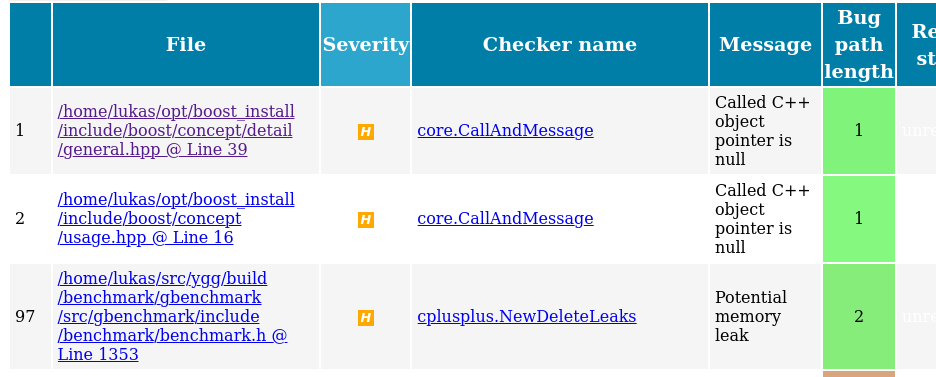
I have sorted the table by severity. You may notice that the two topmost bugs are not actually
inside my own code, but under ~/opt/boost_install, where a custom version of Boost lives. We see
that clangsa does not only find (suspected) bugs in your own code, but potentially also in the
libraries you use.
We can filter out these (suspected) bugs in external libraries by filtering on the file paths that
we are interested in. CodeChecker offers two ways of doing that: With a simple --file filter
argument (which accepts the usual globbing syntax), and a more flexible skipfile system. With Ygg,
there are actually several paths I want to exclude:
~/opt/boost_install~/src/ygg/build/benchmark/gbenchmark~/src/ygg/build/test/gtestThe latter two paths are builds of the Google Benchmark and Google Test libraries automatically
performed while building Ygg. We solve this by creating this skipfile in ~/src/ygg/check/skip_parse:
1-/home/lukas/opt/boost_install/*
2-/home/lukas/src/ygg/build/benchmark/gbenchmark
3-/home/lukas/src/ygg/build/test/gtest
And with that, re-running the parse command as:
1~/src/ygg/check> CodeChecker parse report -e html -o html_out --skip skip_parse
This should give you the desired HTML page at html_out/index.html.
If you are happy with this workflow of manually creating a static HTML overview and filtering only via a skip file, you can now skip straight ahead to Interpreting the Results. Otherwise, read the next section about the CodeChecker server that not only brings a nice interactive GUI with extensive filtering capabilities, but also allows you to collaborate, keep track of bugs, false positives and their fixes, and much more.
The CodeChecker server offers a way of uploading result folders to have the results permanently available, especially in a setting where multiple people want to work on the same code. There are a lot of configuration options, especially around authentication and whether to use a SQLite or PostgreSQL, which you should have a look at if you want to deploy this in a way that is accessible from outside your own machine - however, this would exceed the scope of this article.
For now, we start the CodeChecker server by simply running CodeChecker server. This starts a
server in a way that is only accessible from your machine, without any required authentication:
1~/> CodeChecker server
2[…]
3[INFO 2023-06-08 10:36] - Product 'Default' at '/home/lukas/.codechecker/Default.sqlite' created and set up.
4[…]
5[INFO 2023-06-08 10:36] - CodeChecker server's example configuration file created at '/home/lukas/.codechecker/server_config.json'
6[…]
7[INFO 2023-06-08 10:36] - Server waiting for client requests on [localhost:8001]
There’s more logging, but these lines highlight the most important aspects:
Default is automatically created. The CodeChecker server partitions everything into
products, so that you can use it with multiple codebases.~/.codechecker/ as its storage directory. You can override this with -w.${workdir}/server_config.json.8001.If you point your browser to http://localhost:8001, you should see something like this:
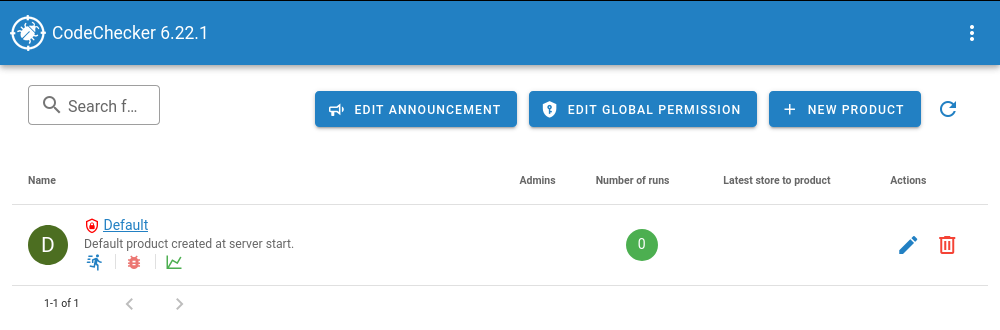
We see the created ‘Default’ product here (and buttons where we could create a different product, or
where we can rename ‘Default’). In the column ‘Number of runs’, it shows a zero. A ‘run’ is one set
of reports created by CodeChecker analyze that was uploaded to the server. To see something
useful, we need to do just that via CodeChecker store. So, from the check directory in which we
worked earlier, we run:
1~/src/ygg/check> CodeChecker store --name 'first_run' --url http://localhost:8001/Default ./report
2[INFO 2023-06-08 10:48] - Storing analysis results for run 'first_run'
3[…]
There should be a lot more logging, it should especially print out another set of statistics at the
end. Note that we need to give a name to this run with the argument --name.4
Also note that the upload URL contains the product name - so, if you created a different product (or
changed the URL endpoint of Default), you need to replace ‘Default’ in the --url argument.
If you now reload the server website, you should see one run. Click on ‘Default’ and it should show you this:
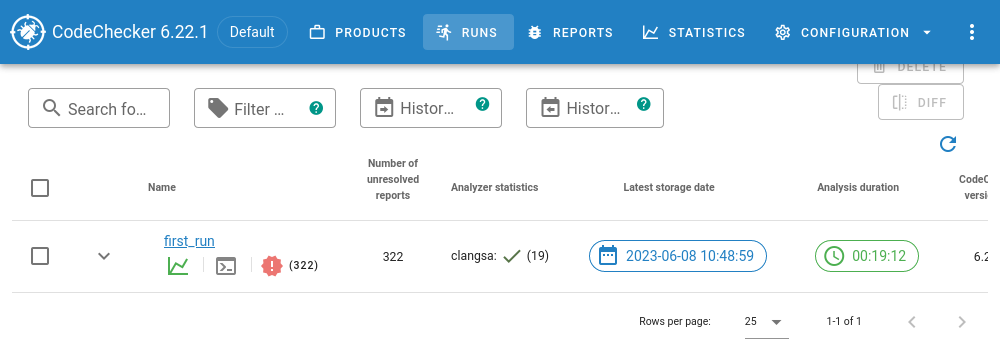
Open the run by clicking on first_run, and you see what I consider the ‘main view’ of CodeChecker server:
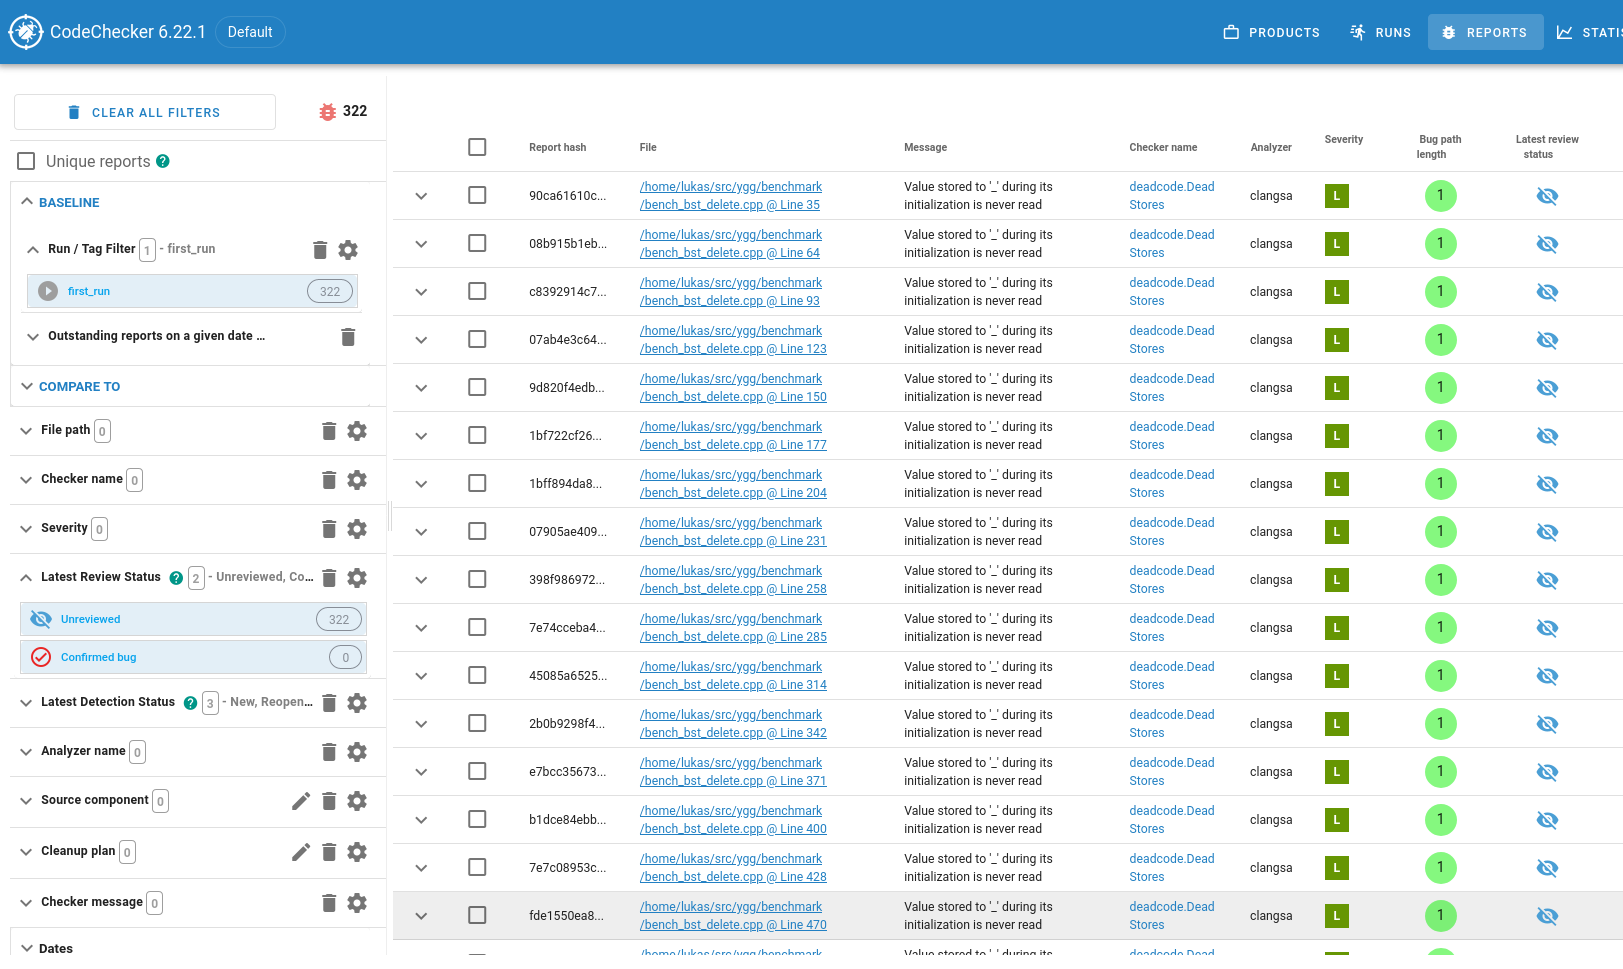
On the left, there is a column with extensive filtering capabilities. Because we reached this view
by clicking on the first_run run, a filter for that run is preselected. Also, it by default only
shows bugs which are in the “Unreviewed” or “Confirmed Bug” state. If we wanted to mimic the path
filter from the previous section, we could use the “Path” filters here. The first thing that I
usually do is to add a “Severity” filter to have a look at the suspected bugs starting with “really
bad” and ending with “not so bad”.
Clicking any of the rows in the table on the right takes you to a code listing similar to the one in the static HTML case from the previous section. The most important difference is this menu bar on top of the listing:

This is where collaboration with your colleagues happens. You can start a comment thread to discuss
this bug, change the bug’s state (it is currently in ‘Unreviewed’ state, other possible states are
‘Confirmed Bug’, ‘False Positive’ and ‘Intentional’), or even show a git blame.
CodeChecker server can do a lot more for you than what I have just outlined. It is especially
powerful if one uses it continually, uploading updated analysis runs after the code was changed,
which allows you to track how bugs where fixed (or new bugs where introduced) - but that would go
beyond the scope of this tutorial. If you end up using CodeChecker server, you should especially
have a look at the CodeChecker cmd invocation, which serves as a command-line interface to the
CodeChecker server.
The most important task when working with CodeChecker still remains: Actually figuring out whether this is a bug, and how to fix it - check out the next section.
Opening one of the suspected-bug reports gives you a page with a code listing interspersed with
little message bubbles that explain the code path that clangsa assumed to be taken:
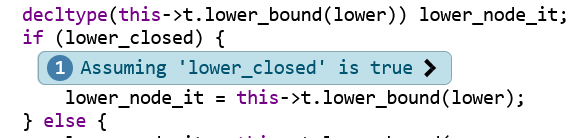
This bubble tells us that the code path found by clangsa (and which leads to the suspected bug)
goes through the if-branch (the line lower_node_it = this->t.lower_bound(lower);). Often, the
control flow that leads to the suspected bug is complex, i.e., multiple such control-flow
assumptions are necessary (this is what the “Bug path length” column in the overview table says). To
make it easier to trace the control flow, the annotations are numbered on their left side, and have
little clickable arrows left and right that allow you to jump from one annotation to the previous or
next.
Note that there often are some control-flow annotations that could be left out to reproduce the bug. In this example, I’m pretty sure this first (and second, third and fourth) of the control-flow assumptions could be left out without affecting the (suspected) bug.
Let’s try to analyze this example. I like to start at the very last annotation, which highlights the suspected bug and is easily recognizable because it is red:
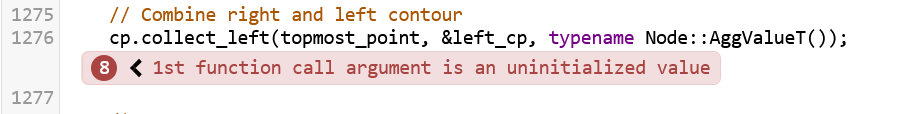
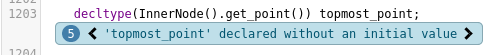
So in this example, Clang claims that topmost_point can be used uninitialized, which would in fact
be UB. Let’s trace back. Annotations 6 and 7 look like this (with some irrelevant code cut out for clarity):
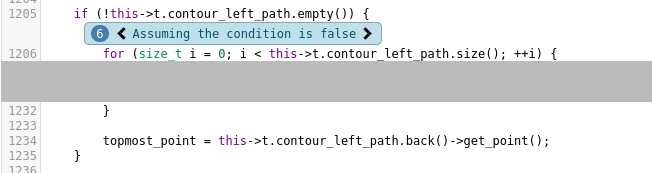
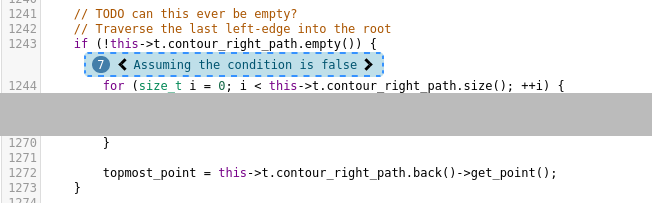
The irony of my previous self placing the // TODO can this ever be empty? there… In fact, these
two if blocks are the only places where topmost_point is ever initialized. Going one annotation
further back shows us:
… and that’s all there is that involves topmost_point. So, if clangsa is correct in its
assumptions and it is indeed possible that both if-blocks are not taken, this would in fact be
UB.5 Nice catch, clangsa!
I think that CodeChecker and the static analyzers it orchestrates can be an incredibly valuable tool in software development, especially for hard-to-spot bugs. For example, the most common type of bug that I found with this so far are memory leaks in error handling procedures. These procedures run infrequently enough so that you don’t notice the memory leak immediately, and with a little bad luck they even only run in production6, so that other tools like ASAN have no way of finding these.
Personally, I’m still only using CodeChecker on my own, we have no central running CodeChecker server instance at work, but I still use CodeChecker server to keep track of which bugs I reviewed, and which were fixed. Integrating this with a CI system would probably be a bit of work, but might be a valuable task for the future.
By default, CodeChecker
uses plain clang, even for C++ sources - so the LLVM 16 equivalent would have been
/usr/bin/clang-16. However, I had to switch it to clang++-16 to work for me. ↩︎
As of 2023-06-05. The CodeChecker folks are working on making this a lot easier. So depending on when you read this, check out if there’s an easier way by now. ↩︎
If you disabled CTU, you will of course only see a single pass. ↩︎
We could also have
named that run already when running CodeChecker analyze, which also accepts a --name argument. ↩︎
I don’t think that is possible in this case, though. Again, it’s been a while since I wrote that code, but at least one of these so-called ‘contours’ of a dynamic segment tree should be non-empty. I’ll still have to look at this further. ↩︎
Of course we all have 100% line coverage in our tests, right? ↩︎
You can use your Mastodon account to reply to this post.